Guide: Create Custom Activity Maps - My Adventure Map
Email Us
Email ons
info@myadventuremap.nl
DM Us on Insta
Insta ons!
@MyAdventureMap
Send us a WhatsApp!
Stuur ons een Appje!
+31 6 4526 5266 06 4526 5266

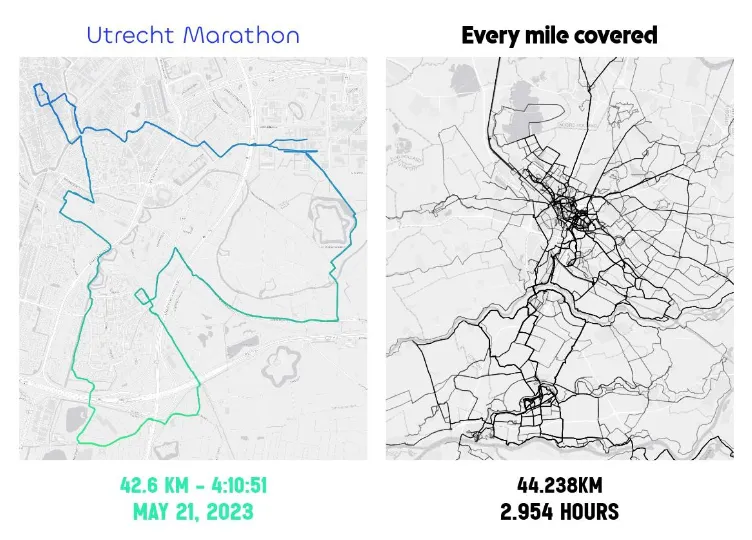
Create Custom Strava Heatmaps in Minutes: A Simple Guide

Maak Aangepaste Strava Heatmaps in Minuten: Een Simpele Gids

Turn your running routes, cycling adventures, and outdoor activities into personalized Strava heatmaps and wall art. Whether you're creating a gift for a runner without needing their Strava login, or designing something for yourself, this tool makes it fast and straightforward.

Verander je hardlooproutes, fietsavonturen en buitenactiviteiten in gepersonaliseerde Strava-heatmaps en kunst aan de muur. Of je nu een cadeau maakt voor een hardloper zonder hun Strava-inloggegevens nodig te hebben, of iets voor jezelf ontwerpt, deze tool maakt het snel en eenvoudig.

This guide shows you how to use every feature. The entire process takes about 5-10 minutes, and you'll see your design update instantly as you make changes.

Deze gids laat zien hoe je elke functie gebruikt. Het hele proces duurt ongeveer 5-10 minuten en je ziet je ontwerp direct bijwerken terwijl je wijzigingen aanbrengt.

What You Need Before Starting

Wat Je Nodig Hebt Voordat Je Begint

Option 1: GPX Files (Great for Gifts!)

Optie 1: GPX-bestanden (Perfect voor Cadeaus!)

  • Just the GPX file from any fitness tracker (Garmin, Apple Watch, Wahoo, etc.)
  • No account needed, no login required
  • Perfect when creating a surprise gift
  • Alleen het GPX-bestand van een fitnesstracker (Garmin, Apple Watch, Wahoo, enz.)
  • Geen account nodig, inloggen niet vereist
  • Perfect voor het geven van een poster als cadeau

Option 2: Strava (Fastest for Your Own Activities)

Optie 2: Strava (Het snelst voor je eigen activiteiten)

  • Your Strava account
  • 1 minute to authorize the connection
  • Instant access to all your activities with full data
  • Je Strava-account
  • 1 minuut om te verbinden
  • Direct toegang tot al je activiteiten met volledige gegevens

That's it! No design experience needed.

Dat is alles! Geen ontwerpervaring nodig.


Step 1: Import Your Activities

Stap 1: Importeer je Activiteiten

Upload GPX Files (Recommended for Gifts)

Upload GPX Bestanden (Ideaal voor Cadeaus)

Click "Upload GPX" and drag your activity file into the upload zone. The tool automatically extracts everything it needs: the route, elevation data, and timing information.

Klik op "Upload GPX" en sleep je activiteitsbestand naar het uploadgebied. De tool haalt automatisch alles op wat nodig is: de route, hoogtegegevens en tijdsinformatie.

💡 Why this is great for gifting: You can create a custom heatmap or specific posters for someone's marathon, century ride, or special hike without needing access to their Strava account. Download the GPX files and you have everything you need to create a custom heatmap or poster. See Gifts for more information. 💡 Waarom dit geweldig is voor cadeaus: Je kunt een aangepaste heatmap of specifieke posters maken voor iemands marathon, lange rit of speciale wandeling zonder toegang tot hun Strava-account nodig te hebben. Download de GPX bestanden en je hebt alles wat je nodig hebt om een aangepaste heatmap of poster te maken. Zie Cadeaus voor meer informatie.

Pro tip: Upload multiple GPX files at once to create a heatmap showing all their training routes or a year's worth of adventures.

Pro tip: Upload meerdere GPX-bestanden tegelijk om een heatmap te maken die al hun trainingsroutes of een jaar aan avonturen toont.

Connect Your Strava Account

Verbind je Strava Account

For your own activities, click the button below to authorize access. You'll see all your activities appear instantly with complete data.

Voor je eigen activiteiten, klik op de knop hieronder om toegang te autoriseren. Je ziet al je activiteiten direct verschijnen met volledige gegevens.

The tool automatically fetches:

De tool haalt automatisch op:

  • Route coordinates with high precision
  • Elevation data for gradient coloring
  • Heart rate, power, and velocity metrics (when available)
  • Activity details (distance, time, title, kudos, date)
  • Routecoördinaten met hoge precisie
  • Hoogtegegevens voor het detecteren van klimmen
  • Hartslag, vermogen en snelheidsmetingen (indien beschikbaar)
  • Activiteitsdetails (afstand, tijd, titel, kudo's, datum)

Step 2: Select Your Activities

Stap 2: Selecteer je Activiteiten

Browse Your Activities

Blader door je Activiteiten

Once connected, your activities appear in a filterable list. You can see the sport type, dates, and distances at a glance.

Eenmaal verbonden, verschijnen je activiteiten in een filterbare lijst. Je ziet miniaturen, datums en afstanden in één oogopslag.

Use the date range selector or activity type chips to quickly find the specific runs or rides you want to map.

Gebruik de datumbereik-kiezer of activiteitstype-chips om snel de specifieke run of rit te vinden die je wilt in kaart brengen.

Use the filters to find specific activities:

Gebruik de filters om specifieke activiteiten te vinden:

  • Date Range: Select activities from a specific period
  • Activity Type: Filter by Run, Ride, Hike, Walk, or other sports
  • All On/Off Buttons: Toggle entire groups with one click
  • Datumbereik: Selecteer activiteiten uit een specifieke periode
  • Activiteitstype: Filter op Hardlopen, Fietsen, Wandelen of andere sporten
  • Alles Aan/Uit Knoppen: Schakel hele groepen in of uit met één klik

Or use the Trophy Case (Automatic Highlights)

Of gebruik de Prijzenkast (Automatische Hoogtepunten)

Click the "Trophy Case" tab to instantly see your best performances. The tool automatically finds achievements like:

Klik op het tabblad "Prijzenkast" om direct je beste prestaties te zien. De tool vindt automatisch prestaties zoals:

  • Longest run or ride
  • Largest elevation gain
  • Fastest 5K, 10K, half marathon, or marathon
  • Most recent century ride
  • Last 12 months heatmap
  • Langste hardloopactiviteit of fietsrit
  • Grootste klim
  • Snelste 5K, 10K, halve marathon of marathon
  • Meest recente 'century ride'
  • Heatmap van de laatste 12 maanden

No searching needed: Just click any trophy to load that activity.

Geen zoeken nodig: Klik gewoon op een trofee om die activiteit te laden.

📸 SCREENSHOT PLACEHOLDER: The Trophy Case interface displaying cards for different achievements with preview maps, metrics, and "Select This Activity" buttons.

Image filename: guide_trophy_case.png
📸 SCREENSHOT PLACEHOLDER: De Prijzenkast-interface die kaarten toont voor verschillende prestaties met voorbeeldkaarten, statistieken en "Selecteer Deze Activiteit"-knoppen.

Bestandsnaam afbeelding: guide_trophy_case.png

Single Activity vs. Multiple Activities

Enkele Activiteit vs. Meerdere Activiteiten

Single Activity: Select one activity to unlock automatic features:

Enkele Activiteit: Selecteer één activiteit om automatische functies te ontgrendelen:

  • Elevation profile graphs (auto-enabled for activities with 100m+ elevation)
  • Gradient coloring based on your data (altitude, grade, velocity, heart rate, power)
  • Smart automatic text suggestions with your activity stats
  • Hoogteprofielgrafieken (automatisch ingeschakeld voor activiteiten met 100m+ hoogteverschil)
  • Hellingkleuring op basis van je gegevens (hoogte, helling, snelheid, hartslag, vermogen)
  • Slimme automatische tekstsuggesties met je activiteitsstatistieken

Multiple Activities (Heatmap): Check multiple activities to create an overlay showing training patterns or favorite routes.

Meerdere Activiteiten (Heatmap): Vink meerdere activiteiten aan om een overlay te maken die trainingspatronen of favoriete routes toont.

Heatmap Single Comparison

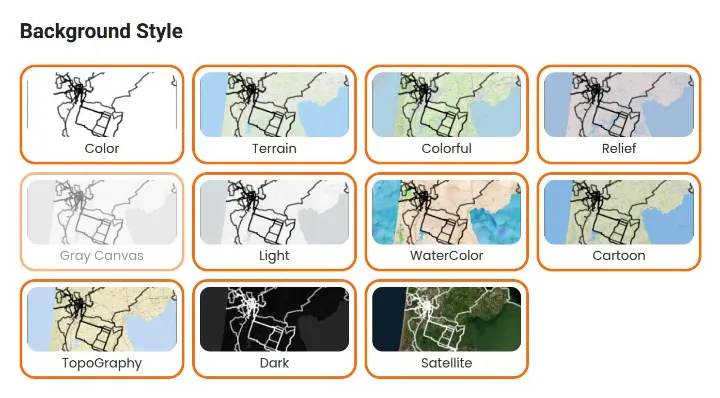
Step 3: Choose Your Background Style

Stap 3: Kies je Achtergrondstijl

Select Your Look

Selecteer je Look

Select from 11 map styles. Each preview shows exactly what you'll get. The map updates instantly when you click a new style it directly updates.

Selecteer uit 11 kaartstijlen. Elk voorbeeld laat precies zien wat je krijgt. De kaart werkt direct wanneer je op een nieuwe stijl klikt.

Available Styles

Beschikbare Stijlen

  • Color: Clean, modern street maps
  • Terrain: Topographic detail with landscape features
  • Colorful: Vibrant streets and landmarks
  • Relief: 3D-style elevation shading
  • Light: Minimalist grayscale
  • WaterColor: Artistic, hand-painted look
  • Cartoon: Playful and bold
  • TopoGraphy: Classic topographic lines
  • Dark: Black background for high contrast
  • Satellite: Real satellite imagery
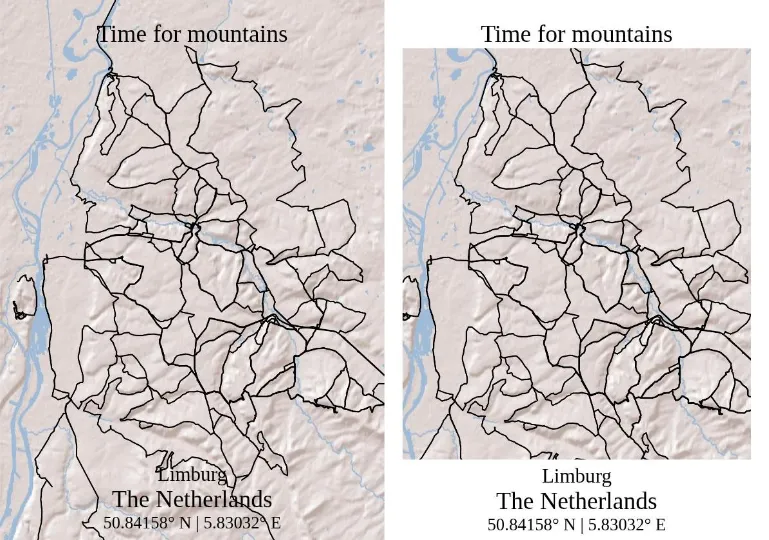
  • Color: Schone, moderne straatkaarten
  • Terrain: Topografisch detail met landschapskenmerken
  • Colorful: Levendige straten en monumenten
  • Relief: 3D-stijl hoogte-arcering
  • Light: Minimalistisch grijstinten
  • WaterColor: Artistieke, handgeschilderde look
  • Cartoon: Speels en gedurfd
  • TopoGraphy: Klassieke topografische lijnen
  • Dark: Zwarte achtergrond voor hoog contrast
  • Satellite: Echte satellietbeelden
Background styles

Add a Photo Border

Voeg een Fotorand Toe

Enable "Border" to add a white photo mat around your map for a framed look. This gives your poster a gallery-ready appearance.

Schakel "Border" in om een witte fotomat rond je kaart toe te voegen voor een ingelijste look. Dit geeft je poster een galerie-klare uitstraling.

Border option

Upload Your own Photos

Upload Eigen Foto's

Add race photos, summit selfies, or logos by clicking "Upload Image." You can position and resize them on your map to add a personal touch.

Voeg racefoto's, top-selfies of logo's toe door op "Upload Afbeelding" te klikken. Je kunt ze positioneren en vergroten/verkleinen op je kaart om een persoonlijk tintje toe te voegen.

Step 4: Color your routes

Stap 4: Geef je routes kleur

Line Styling & Customization

Lijnstijl & Aanpassing

Choose "OneColor" and pick any color using the color picker. You can also adjust the Line Width and Opacity to create the perfect heatmap effect, especially when combining multiple activities.

Kies "OneColor" en kies een kleur met de kleurkiezer. Je kunt ook de Lijndikte en Doorzichtigheid aanpassen om het perfecte heatmap-effect te creëren, vooral bij het combineren van meerdere activiteiten.

📸 SCREENSHOT PLACEHOLDER: Color picker interface open with a purple route displayed on a light background map.

Image filename: guide_color_picker.png
📸 SCREENSHOT PLACEHOLDER: Kleurkiezer-interface open met een paarse route weergegeven op een lichte achtergrondkaart.

Bestandsnaam afbeelding: guide_color_picker.png

Dynamic Gradients

Dynamische Gradiënten

Select "Simple Gradient" for a smooth color transition. Use the rotation slider to change the gradient direction to create diagonal, horizontal, or vertical flows.

Selecteer "Simple Gradient" voor een soepele kleurovergang. Gebruik de rotatieschuifregelaar om de gradiëntrichting te wijzigen om diagonale, horizontale of verticale stromen te creëren.

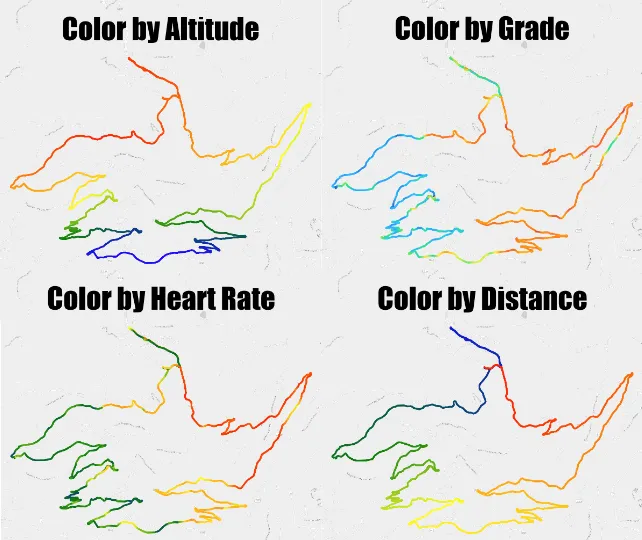
Automatic Data-Based Coloring

Automatische Gegevensgebaseerde Kleuring

This is where the tool really shines. It automatically detects what data you have and offers smart coloring options:

Hier blinkt de tool echt uit. Het detecteert automatisch welke gegevens je hebt en biedt slimme kleuropties:

  • Altitude: Hill tops in red, valleys in blue.
  • Grade: Automatically detects steep sections. Flat areas stay neutral, climbs show in warm colors.
  • Velocity: To visualize your pace.
  • Heart Rate: Show your heart rate in color.
  • Power: Shows where you pushed hardest.
  • Hoogte: Bergtoppen in rood, valleien in blauw.
  • Grade: Detecteert automatisch steile secties. Vlakke gebieden blijven neutraal, beklimmingen worden weergegeven in warme kleuren.
  • Velocity: Toon je snelheid op de kaart.
  • Heart Rate: Toon je hartslag in kleur.
  • Power: Toont waar je het hardst hebt gestreden.
Coloring modes

Elevation Profile Graph

Hoogteprofiel

For activities with significant elevation (100m+), the tool automatically enables and displays an elevation profile graph below your map. The graph uses the same coloring as your route.

Voor activiteiten met aanzienlijk hoogteverschil (100m+), schakelt de tool automatisch een hoogteprofiel in en toont deze onder je kaart. De grafiek gebruikt dezelfde kleuring als je route.

You can toggle it on or off for any activity, even flat ones.

Je kunt het voor elke activiteit in- of uitschakelen, zelfs voor vlakke.

Step 5: Add Text (Automatic Suggestions)

Stap 5: Voeg Tekst Toe (Automatische Suggesties)

Smart Text Suggestions

Slimme Tekstsuggesties

Click any text field and you'll see smart suggestions based on your activity data. Just drag and drop:

Klik op een tekstveld en je ziet slimme suggesties op basis van je activiteitsgegevens. Sleep en zet neer:

  • Activity Name
  • Distance (e.g., "42 km")
  • Elevation Gain (e.g., "1,250 m")
  • Time (automatically formatted)
  • Date Range
  • Coordinates
  • Activity Name: Activiteitsnaam
  • Distance: Afstand (bijv. "42 km")
  • Elevation Gain: Hoogtewinst (bijv. "1.250 m")
  • Time: Tijd (automatisch geformatteerd)
  • Date Range: Datumbereik
  • Coordinates: Coördinaten

The tool calculates everything from your activity data and gives automatic smart suggestions.

De tool berekent alles uit je activiteitsgegevens en geeft automatisch slimme suggesties.

Customize Your Text

Pas je Tekst Aan

You have four text fields:

Je hebt vier tekstvelden:

  • Map Title: Large, bold text
  • Bottom Text 1, 2, 3: Three lines for stats or custom messages
  • Map Title: Kaarttitel: Grote, dikke tekst
  • Bottom Text 1, 2, 3: Ondertekst 1, 2, 3: Drie regels voor statistieken of aangepaste berichten

Leave fields blank for a minimal look, or fill them all for detailed information.

Laat velden leeg voor een minimale look, of vul ze allemaal voor gedetailleerde informatie.

Done!

Klaar!

Export Your Masterpiece (TODO)

Exporteer je Meesterwerk (TODO)

Click "Download as PNG" or "Download as PDF."

Klik op "Download als PNG" of "Download als PDF".

  • PNG: For digital sharing (social media, online)
  • PDF: For printing (maintains quality at any size)
  • PNG: Voor digitaal delen (sociale media, online)
  • PDF: Voor afdrukken (behoudt kwaliteit op elk formaat)

Your file downloads instantly.

Je bestand downloadt direct.

📹 GIF PLACEHOLDER: User clicking the "Download" button, a brief loading animation, then the browser's download notification appearing with the finished file.

Image filename: guide_download.gif
📹 GIF PLACEHOLDER: Gebruiker klikt op de knop "Download", een korte laadanimatie, vervolgens verschijnt de downloadmelding van de browser met het voltooide bestand.

Bestandsnaam afbeelding: guide_download.gif

Quick Tips

Snelle Tips

🎁 For Gifting Without Strava Access

🎁 Voor Cadeaus Zonder Strava Login

Ask for the GPX file export from their fitness tracker or download it from Strava (you can do that if you follow them, see gift for more). You can create the entire map without needing their account login. This makes surprise gifts easy.

Vraag om de GPX-bestandsexport van hun fitnesstracker of download het bestand van Strava (dat kan als je ze volgt, zie cadeau voor meer). Je kunt de hele kaart maken zonder hun accountlogin nodig te hebben. Dit maakt verrassingscadeaus gemakkelijk.

🏆 Use the Trophy Case

🏆 Gebruik de Prijzenkast

Instead of scrolling through hundreds of activities, let the tool automatically find the best ones. Click "Trophy Case" and pick from the highlights.

In plaats van door honderden activiteiten te scrollen, laat de tool automatisch de beste vinden. Klik op "Prijzenkast" en kies uit de hoogtepunten.

⚡ Let Auto-Detection Work

⚡ Laat Auto-Detectie Werken

For activities with elevation, the tool automatically selects Grade coloring and shows the profile graph. You can change it, but the defaults usually work great.

Voor activiteiten met hoogteverschil selecteert de tool automatisch Hellingkleuring en toont de profielgrafiek. Je kunt het wijzigen, maar de standaardinstellingen werken meestal geweldig.

🔥 Try the Year Heatmap

🔥 Probeer de Jaarlijkse Heatmap

Select all activities from the past year to see training patterns. The tool handles multiple activities smoothly: just click the button and it creates the heatmap.

Selecteer alle activiteiten van het afgelopen jaar om trainingspatronen te zien. De tool verwerkt meerdere activiteiten soepel: klik gewoon op de knop en het maakt de heatmap.

Start Creating Your Adventure Map

Begin met het Maken van je Adventure Map

You now know how to use every feature. The tool handles most decisions automatically (grade detection, profile graphs, text suggestions), so you can focus on the creative choices that matter.

Je weet nu hoe je elke functie moet gebruiken. De tool handelt de meeste beslissingen automatisch af (hellingdetectie, profielgrafieken, tekstsuggesties), zodat jij je kunt concentreren op de creatieve keuzes die ertoe doen.

Create Your Adventure Map Now → Maak Nu Je Adventure Map →

Questions? Send us an email at pieter@myadventuresmap.com, we're here to help!

Vragen? Stuur ons een e-mail op pieter@myadventuresmap.com, we zijn er om te helpen!

Get In Touch
Neem contact op

We are open to suggestions and bug reports. Please reach out to us!

We staan open voor suggesties. Neem aub contact met ons op!

info@myadventuremap.nl

@MyAdventureMap

 +31 6 4526 5266  06 4526 5266
Popular Links
Populaire Links
Newsletter
Nieuwsbrief

Sign up for updates on the site, discounts and more!
About once per month.

Meld je aan over updates van de site, kortingen en meer!
Ongeveer eens per maand.

© Map Your Adventures. All rights reserved.

© Map Your Adventures. Alle rechten voorbehouden.